Project Reports
Introduction
Project Reports provide comprehensive analytics and insights into your trading and shipping operations. Generate detailed reports to track performance, analyze trends, and make data-driven decisions.
Accessing Project Reports
Navigation:
- Click on Project Report in the left sidebar
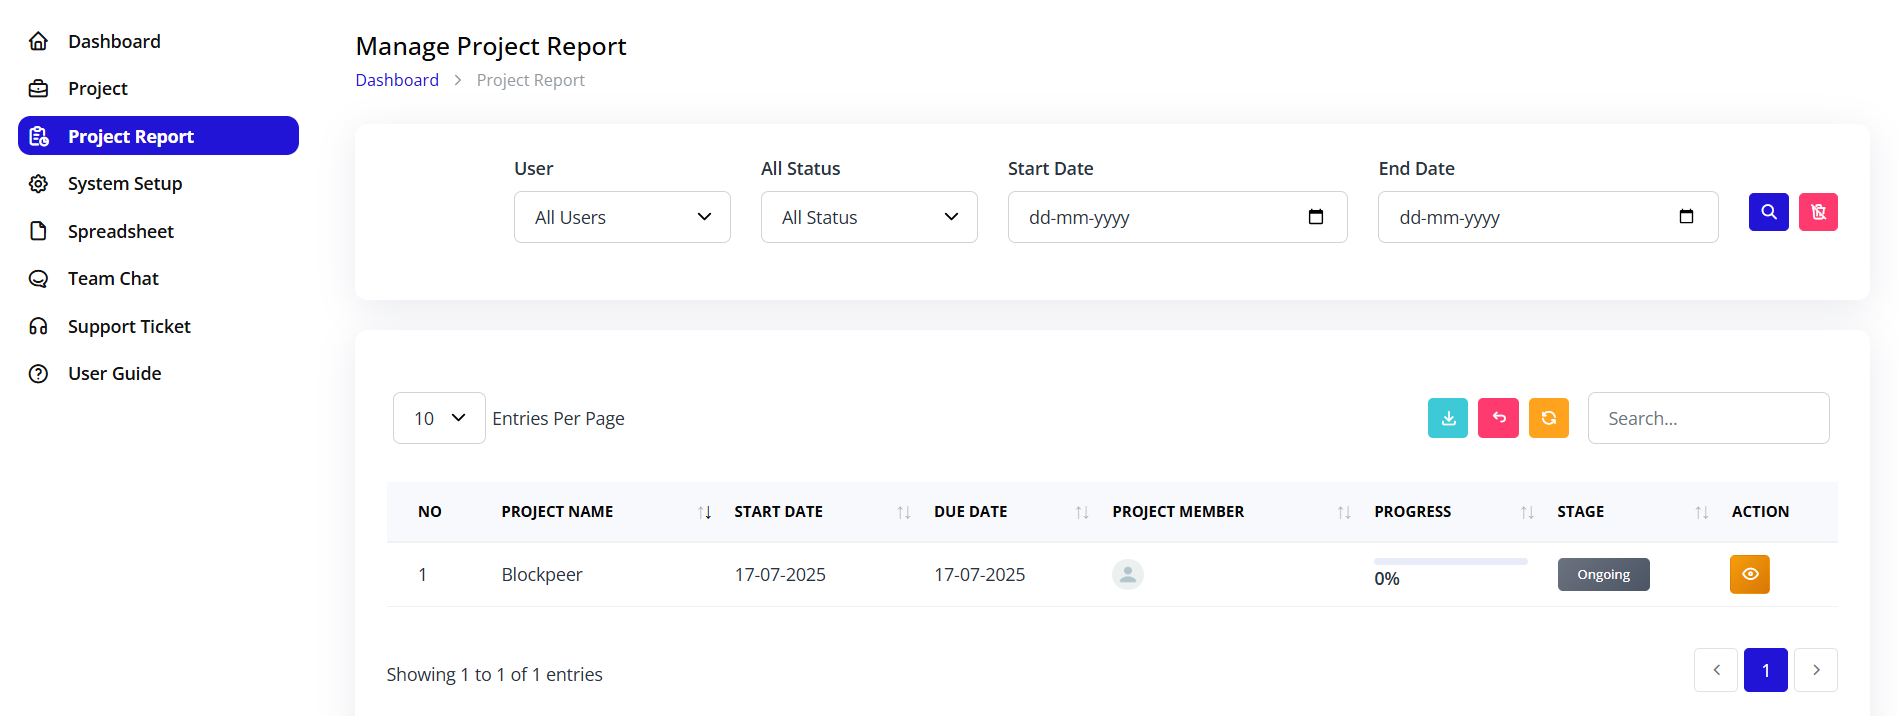
- You'll land on the "Manage Project Report" page
- Breadcrumb shows: Dashboard > Project Report
Purpose:
- Analyze project performance
- Track team productivity
- Monitor timelines and deadlines
- Generate stakeholder reports
- Export data for analysis
Project Report Interface
Report Filters

The Project Report page provides comprehensive filtering options to generate custom reports:
Filter Options
1. User Filter
- Label: "User"
- Type: Dropdown
- Default: "All Users"
- Options:
- All Users (shows all projects)
- Individual team members
- Multiple selection possible
- Purpose: Filter projects by assigned users
2. Status Filter
- Label: "All Status"
- Type: Dropdown
- Default: "All Status"
- Options:
- All Status
- Ongoing
- Finished
- OnHold
- Purpose: Filter by project status
3. Date Range Filters
Start Date:
- Label: "Start Date"
- Type: Date picker
- Format: dd-mm-yyyy
- Function: Show projects starting from this date
End Date:
- Label: "End Date"
- Type: Date picker
- Format: dd-mm-yyyy
- Function: Show projects ending before this date
4. Action Buttons
Search Button:
- Icon: Magnifying glass (blue)
- Function: Apply filters and generate report
- Click: Executes the report with selected criteria
Clear Button:
- Icon: X (pink/red)
- Function: Reset all filters to default
- Click: Clears all selected filters
Report Table View
Understanding the Report Table
The report displays projects in a detailed table format with sortable columns.
Table Controls
Entries Per Page:
- Location: Bottom left
- Dropdown: Shows "10" by default
- Options: 10, 25, 50, 100 entries per page
- Purpose: Control how many projects display at once
Search Box:
- Location: Top right
- Placeholder: "Search..."
- Function: Real-time search within results
- Searches: Project name, members, any visible field
Export Buttons:
- Download: Export to Excel
- PDF: Export to PDF
- Print: Print report
Table Columns
NO
- Sequential number
- Helps with counting and reference
- Resets on each page
PROJECT NAME
- Full project name
- Sortable (click header)
- Click name to open project details
- Primary identifier
START DATE
- Project start date
- Format: DD-MM-YYYY
- Sortable column
- Shows project initiation
DUE DATE
- Project deadline
- Format: DD-MM-YYYY
- Sortable column
- Color-coded if overdue (red)
PROJECT MEMBER
- Team member avatars
- Shows assigned users
- Hover for full names
- Click to see member details
PROGRESS
- Numerical progress (0-100)
- Shows completion percentage
- Example: "0" means not started
- Updates based on task completion
STAGE
- Current project status
- Badge display
- Color-coded:
- Gray: Ongoing
- Green: Finished
- Orange: OnHold
- Sortable column
ACTION
- Eye icon (orange)
- Click to view full project details
- Opens project detail page
- Quick access to project
Generating Reports
Step-by-Step Report Generation
Step 1: Select Filters
- Choose user(s) from User dropdown
- Select status from Status dropdown
- Pick start date from calendar
- Pick end date from calendar
Step 2: Apply Filters
- Click the blue Search button
- System processes request
- Table updates with filtered results
- Page count updates
Step 3: Review Results
- Scan the report table
- Sort by any column if needed
- Search within results if needed
- Navigate pages if multiple
Step 4: Export (Optional)
- Click desired export button
- Choose format (Excel, PDF)
- Download file
- Open in appropriate application
Report Examples
Example 1: Active Projects Report
Objective: View all ongoing projects
Filters:
- User: All Users
- Status: Ongoing
- Start Date: (empty - all dates)
- End Date: (empty - all dates)
Steps:
- Select "Ongoing" from Status dropdown
- Click Search button
- Review list of active projects
- Export if needed
Use Case:
- Daily standup meetings
- Resource allocation
- Workload assessment
- Priority setting
Example 2: User Performance Report
Objective: See all projects for specific user
Filters:
- User: [Select specific user, e.g., "Rahul"]
- Status: All Status
- Start Date: Beginning of quarter
- End Date: Today
Steps:
- Select user from User dropdown
- Set date range for quarter
- Click Search
- Review user's project portfolio
Use Case:
- Performance reviews
- Workload analysis
- Capacity planning
- Individual productivity tracking
Example 3: Completed Projects Report
Objective: Review finished projects in date range
Filters:
- User: All Users
- Status: Finished
- Start Date: 01-01-2025
- End Date: 31-03-2025
Steps:
- Select "Finished" status
- Set Q1 date range
- Click Search
- Export to Excel for analysis
Use Case:
- Quarterly reviews
- Success analysis
- Lessons learned
- Billing and invoicing
- Client reporting
Example 4: Overdue Projects Report
Objective: Identify projects past deadline
Filters:
- User: All Users
- Status: Ongoing
- Start Date: (any)
- End Date: Yesterday or earlier
Steps:
- Select "Ongoing" status
- Set End Date to yesterday or earlier
- Click Search
- Projects still ongoing past due date appear
Use Case:
- Risk management
- Escalation identification
- Resource reallocation
- Client communication
Example 5: Team Workload Report
Objective: Assess current team capacity
Filters:
- User: All Users
- Status: Ongoing
- Start Date: Today
- End Date: (empty)
Steps:
- Select "Ongoing" status
- Set Start Date to today
- Click Search
- Review distribution across team
Use Case:
- Capacity planning
- New project assignment
- Resource balancing
- Burnout prevention
Report Analysis
Key Metrics to Track
Project Count:
- Total projects in report
- Distribution by status
- Trend over time
- Comparison to previous periods
Completion Rate:
- Percentage of finished projects
- Average project duration
- Success rate trends
- Goal achievement
Team Performance:
- Projects per team member
- Individual completion rates
- Workload distribution
- Productivity trends
Timeline Adherence:
- On-time completion rate
- Average delay duration
- Projects at risk
- Timeline accuracy
Analyzing Report Data
Look For:
Red Flags:
- Many overdue projects
- Projects stuck in one stage
- Uneven workload distribution
- Low completion rates
- Increasing project durations
Positive Indicators:
- High on-time completion
- Balanced team workload
- Consistent project flow
- Improving metrics
- Meeting or exceeding goals
Trends to Monitor:
- Month-over-month changes
- Seasonal variations
- Team performance patterns
- Project type differences
- Client-specific trends
Exporting Reports
Export to Excel
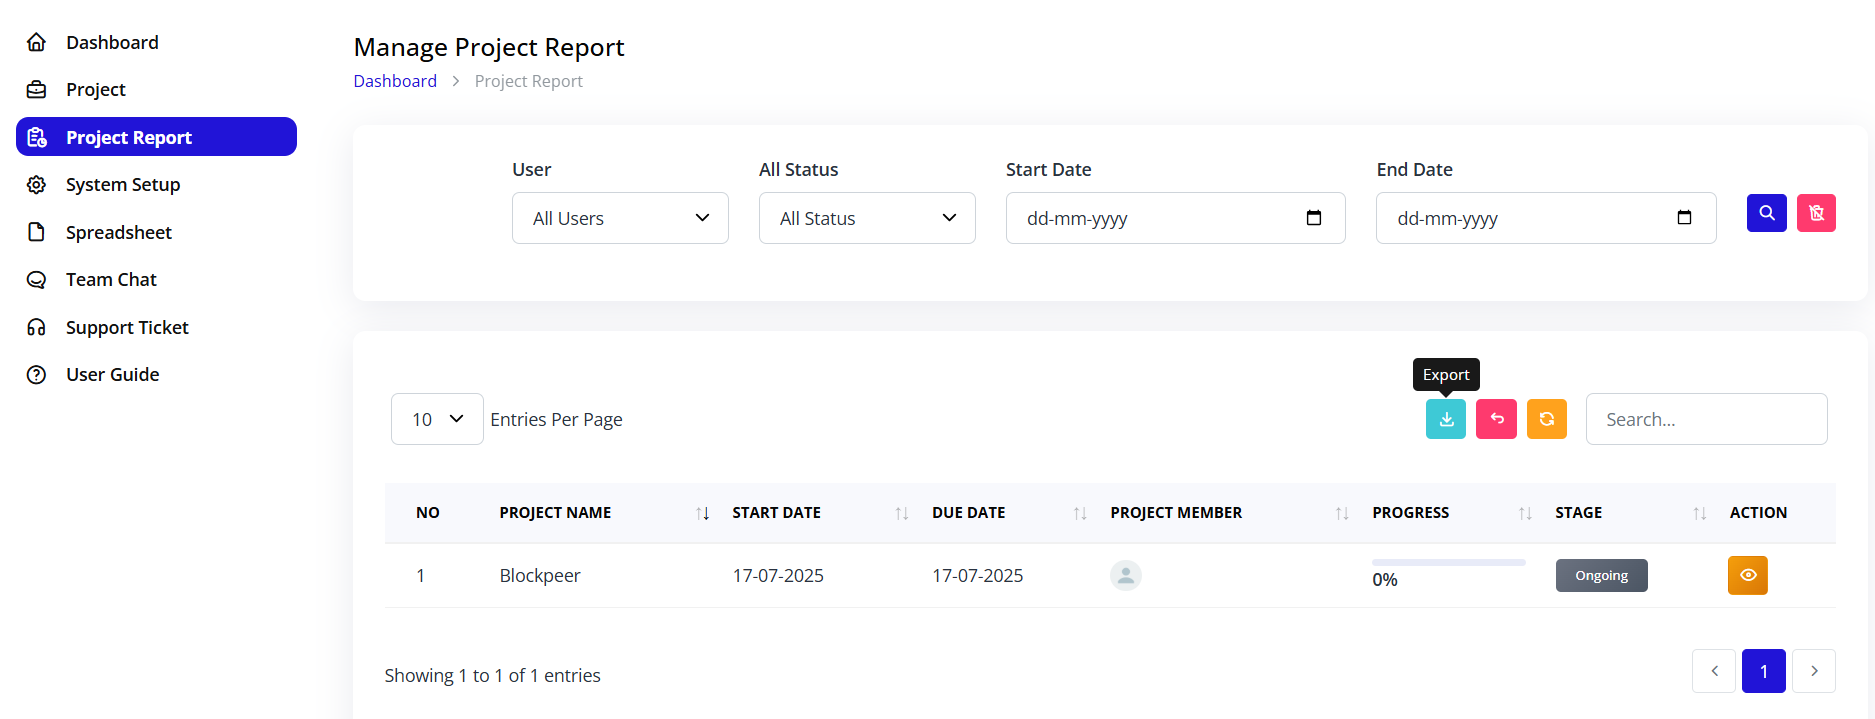
To Export Excel:
- Generate report with desired filters
- Click the Download icon (arrow down)
- File downloads automatically
- Open in Excel or Google Sheets
Excel Export Includes:
- All visible columns
- All rows (not just current page)
- Applied filters documented
- Export timestamp
- Formatted tables
Excel Use Cases:
- Further data analysis
- Pivot tables and charts
- Sharing with non-Trackr users
- Archiving reports
- Integration with other tools
Export to PDF
To Export PDF:
- Generate report
- Click PDF icon
- PDF generates
- Download or print
PDF Export Includes:
- Report title and filters
- Table with all data
- Page numbers
- Export date
- Company branding (if configured)
PDF Use Cases:
- Executive presentations
- Client reports
- Formal documentation
- Email attachments
- Printing for meetings
Print Report
To Print:
- Click Print icon
- Browser print dialog opens
- Select printer
- Adjust settings
Print Options:
- Portrait or landscape
- Page range
- Color or black & white
- Number of copies
- Paper size
Advanced Reporting Features
Custom Report Views
Save Custom Views:
- Configure filters for common reports
- Click "Save View" (if available)
- Name the view
- Access quickly from dropdown
Example Custom Views:
- "My Active Projects"
- "Team Capacity Report"
- "Monthly Completed Projects"
- "High Priority Projects"
- "Client X Projects"
Scheduled Reports
Automate Report Generation:
Configuration:
- Set up report filters
- Enable "Schedule Report"
- Choose frequency:
- Daily
- Weekly (select day)
- Monthly (select date)
- Select recipients
- Choose format (PDF/Excel)
- Save schedule
Recipients Receive:
- Email with report attached
- Consistent format
- Always up-to-date data
- No manual work required
Use Cases:
- Weekly team status
- Monthly executive summary
- Daily operations brief
- Client progress updates
Report Dashboards
Create Visual Dashboards:
- Combine multiple reports
- Add charts and graphs
- Display key metrics
- Real-time updates
- Share with stakeholders
Dashboard Widgets:
- Project count by status
- Team workload chart
- Timeline compliance gauge
- Completion trend graph
- Top performers list
Report Best Practices
Regular Reporting Schedule
Daily Reports:
- Current active projects
- Today's deadlines
- Overdue items
- Quick team overview
Weekly Reports:
- Completed projects
- New projects started
- Team performance
- Upcoming deadlines
- Issues and blockers
Monthly Reports:
- Full project portfolio
- Completion rates
- Trend analysis
- Budget vs actual
- Strategic metrics
Quarterly Reports:
- Comprehensive analysis
- Goal achievement
- Team performance review
- Process improvements
- Strategic planning data
Report Distribution
Internal Distribution:
- Team members: Daily/weekly updates
- Managers: Weekly summaries
- Executives: Monthly/quarterly reports
- Stakeholders: Project-specific reports
External Distribution:
- Clients: Progress updates
- Partners: Collaboration metrics
- Auditors: Compliance reports
- Investors: Performance summaries
Data Accuracy
Ensure Accurate Reports:
- Keep project data current
- Update task statuses promptly
- Maintain accurate dates
- Complete all required fields
- Review before distributing
Data Quality Checks:
- Verify dates are logical
- Check for data entry errors
- Confirm calculations
- Validate against source
- Review outliers
Troubleshooting Reports
Report Not Generating
Issue: Report fails to load or show data
Solutions:
- Check filter settings
- Verify date range is valid
- Ensure data exists for criteria
- Try broader filters
- Refresh page
- Clear browser cache
Wrong Data in Report
Issue: Report shows incorrect or unexpected data
Solutions:
- Verify filter selections
- Check date range
- Ensure proper status selected
- Review user filter
- Confirm project data is current
- Check for filter conflicts
Export Not Working
Issue: Cannot export to Excel or PDF
Solutions:
- Check browser popup blocker
- Ensure sufficient disk space
- Try different browser
- Check file permissions
- Verify export format supported
- Contact administrator
Slow Report Performance
Issue: Report takes long time to generate
Solutions:
- Narrow date range
- Select specific users
- Choose single status
- Reduce data volume
- Check system performance
- Schedule during off-hours
Summary
Effective project reporting enables:
✅ Comprehensive visibility into all projects and operations
✅ Data-driven decisions based on actual performance
✅ Proactive management by identifying issues early
✅ Team accountability through transparent metrics
✅ Stakeholder confidence with regular, accurate updates
✅ Continuous improvement by analyzing trends
✅ Resource optimization through workload analysis
Master project reporting to transform data into actionable insights that drive success.