Getting Started
Introduction
Trackr is Blockpeer's comprehensive project management module designed specifically for trading and shipping operations. It provides real-time visibility into every aspect of your operational workflow, from project initiation to completion.
What is Trackr?
Trackr offers a bird's eye view of your Trading/Shipping Operations, enabling you to:
- Monitor Operations in Real-Time: Track every trade, shipment, and financing milestone as they happen
- Complete Visibility: Get comprehensive insights into all operational activities
- Accountability: Maintain clear audit trails and responsibility tracking
- Collaboration: Enable seamless team communication and coordination
- Reporting: Generate detailed reports for analysis and decision-making
Accessing the Trackr Dashboard
Step 1: Navigate to Dashboard
- Log in to your Blockpeer account
- From the left sidebar navigation, click on Dashboard
- You'll land on the Trackr Dashboard home screen
Understanding the Dashboard
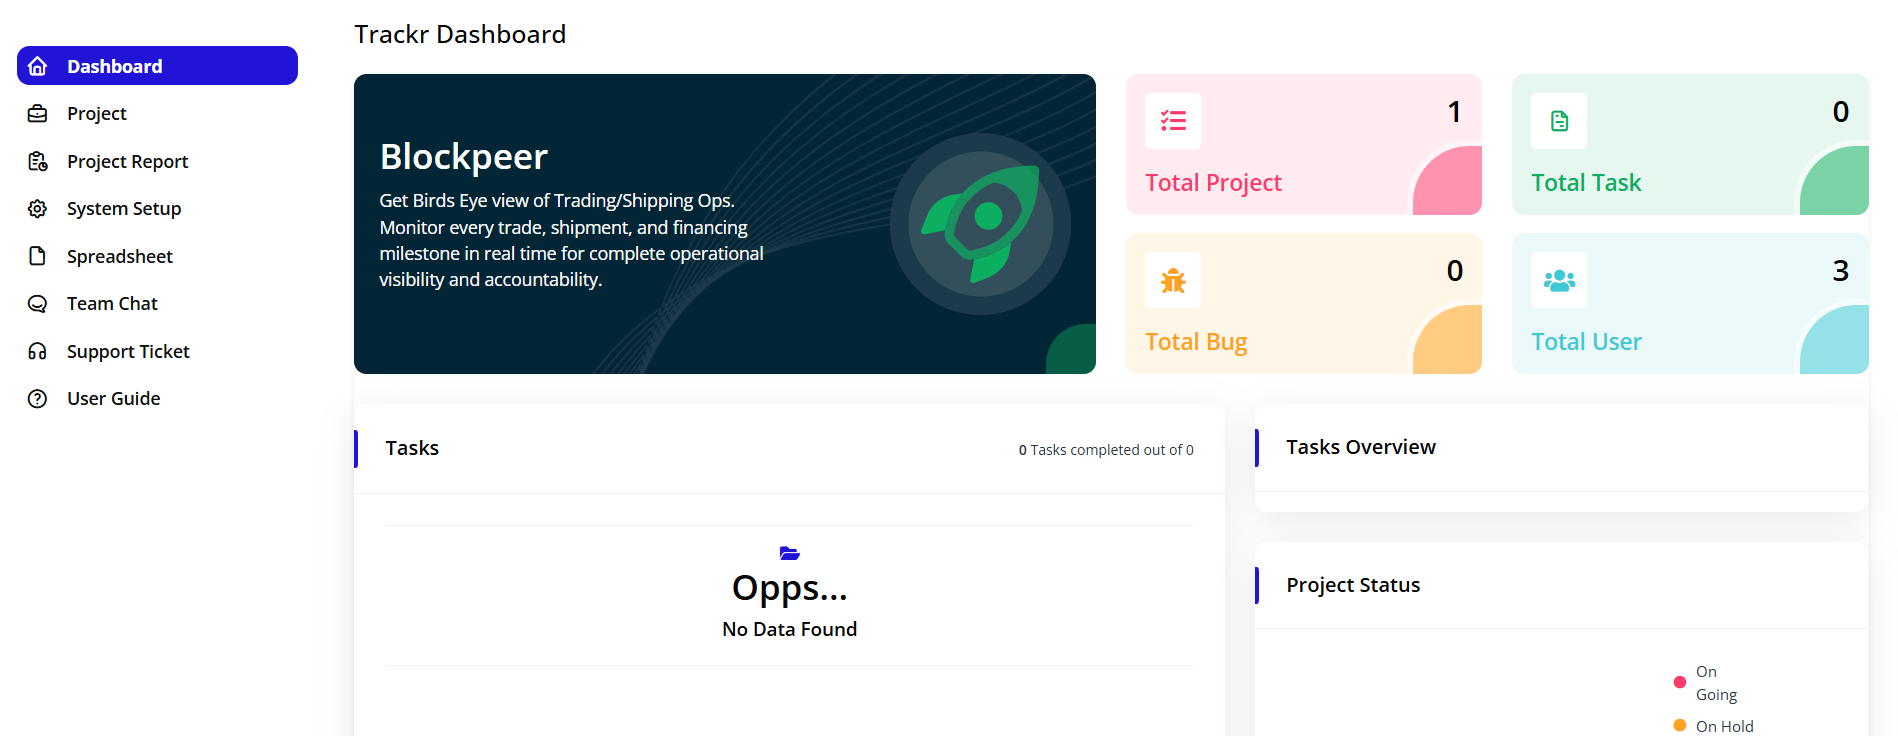
The Trackr Dashboard is divided into several key sections that provide instant insights into your operations.
Dashboard Header
At the top of the dashboard, you'll see:
- Blockpeer Branding: Application logo and name
- Quick Actions: Access to getting started guides and notifications
- User Profile: Your account information and settings
Key Metrics Overview
The dashboard displays four primary metric cards that provide instant visibility into your system's status:
1. Total Projects
- Location: Top left of the dashboard
- Color: Pink background
- Icon: List icon
- Display: Shows total number of projects in the system
- Purpose: Quick view of your project portfolio size
- Click Action: Navigates to the full projects list
What it tells you:
- Current project count across all statuses (Ongoing, Finished, OnHold)
- Visual indicator of workload capacity
2. Total Tasks
- Location: Top right of the dashboard
- Color: Green background
- Icon: Document/task icon
- Display: Shows total number of tasks across all projects
- Purpose: Overview of all task items in the system
- Click Action: Quick access to task management
What it tells you:
- Total task count regardless of status
- Workload distribution indicator
- Task completion ratio (when viewed with completed tasks)
3. Total Bugs
- Location: Bottom left of the dashboard
- Color: Orange background
- Icon: Bug/issue icon
- Display: Number of reported bugs or issues
- Purpose: Quality control and issue tracking
- Click Action: Access to bug management section
What it tells you:
- Current open issues requiring attention
- System quality indicators
- Areas needing improvement
4. Total Users
- Location: Bottom right of the dashboard
- Color: Cyan/light blue background
- Icon: People/users icon
- Display: Total number of users in the system
- Purpose: Team size and user management overview
- Click Action: Navigate to user management
What it tells you:
- Total team members with system access
- Collaboration capacity
- User license utilization
Dashboard Sections
Tasks Section
The Tasks section provides an overview of task completion status:
Header Information:
- Title: "Tasks"
- Completion Counter: "0 Tasks completed out of 0"
- Shows the ratio of completed tasks to total tasks
- Updates in real-time as tasks are marked complete
Empty State:
- When no tasks exist, you'll see:
- Folder icon
- Message: "Opps... No Data Found"
- Indicates you need to create your first project and tasks
Purpose:
- Quick glance at task progress
- Immediate visibility of pending work
- Motivation through completion tracking
Tasks Overview Panel
Location: Right side of the Tasks section
Purpose: Visual representation of task distribution and status
Features:
- Graphical display of task breakdown
- Status-based categorization
- Progress tracking visualization
When Empty:
- Shows placeholder indicating no data available
- Prompts you to create projects and tasks
Project Status Legend
Location: Bottom right of the dashboard
Purpose: Color-coded legend for project statuses
Status Indicators:
-
On Going (Pink/Red Circle)
- Projects currently active
- Work in progress
- Team actively working on deliverables
-
On Hold (Orange Circle)
- Projects temporarily paused
- Awaiting resources or decisions
- Not currently active but not closed
-
Finished (Not shown but available)
- Completed projects
- Delivered and closed
- Archived for reference
How to Use:
- Reference this legend when viewing project cards
- Quickly identify project status at a glance
- Filter projects by status using these categories
Navigation Sidebar
The left sidebar provides access to all Trackr features:
Main Menu Items
-
Dashboard (House Icon)
- Current page indicator (highlighted in blue)
- Returns you to the overview screen
- Shows key metrics and summaries
-
Project (Briefcase Icon)
- Create and manage projects
- View project listings
- Access project details
-
Project Report (Report Icon)
- Generate project analytics
- View performance metrics
- Export reports
-
System Setup (Gear Icon)
- Configure task stages
- Customize workflows
- System preferences
-
Spreadsheet (Document Icon)
- Data management
- Import/export functionality
- Bulk operations
-
Team Chat (Chat Icon)
- Internal communication
- Project discussions
- Real-time messaging
-
Support Ticket (Headset Icon)
- Get help and support
- Submit issues
- Track support requests
-
User Guide (Question Icon)
- Access documentation
- How-to guides
- Feature explanations
Getting Started Checklist
Before you start using Trackr effectively, complete these initial setup steps:
✅ Step 1: System Setup
- Configure task stages (Todo, In Progress, Review, Done)
- Set up trading stages
- Configure shipping stages
- Customize to match your workflow
✅ Step 2: User Management
- Invite team members
- Assign roles and permissions
- Set up user profiles
✅ Step 3: Create Your First Project
- Click on "Project" in the sidebar
- Click "Add Project" button
- Fill in project details
- Assign team members
✅ Step 4: Add Tasks
- Open your project
- Create tasks and milestones
- Assign tasks to team members
- Set due dates and priorities
✅ Step 5: Start Tracking
- Update task statuses as work progresses
- Use the dashboard to monitor progress
- Generate reports for stakeholders
Dashboard Best Practices
Daily Routine
-
Morning Check-in
- Review the dashboard metrics
- Check tasks section for completions
- Identify any blockers (bugs section)
-
Throughout the Day
- Update task statuses as work progresses
- Communicate with team via Team Chat
- Monitor project status changes
-
End of Day
- Review completed tasks
- Plan next day's priorities
- Update project status if needed
Weekly Activities
- Review Project Reports for analytics
- Generate status reports for stakeholders
- Assess team workload (Total Users vs Total Tasks)
- Address accumulated bugs
- Adjust project timelines if needed
Monthly Reviews
- Analyze trends in project completion
- Review team productivity metrics
- Plan new projects based on capacity
- Archive completed projects
- Update system configurations as needed
Understanding Dashboard Data
Real-Time Updates
The dashboard updates automatically when:
- New projects are created
- Tasks are added, updated, or completed
- Users are added or removed
- Bugs are reported or resolved
Data Refresh
- Dashboard data refreshes every time you navigate to it
- Manual refresh: Simply reload the page
- All metrics reflect the current state of your system
Empty State (No Data)
When you first access Trackr or if you have no active items, you'll see:
Display:
- Folder icon with "Opps... No Data Found" message
- Clean, minimal interface
What to do:
- Click on "Project" in the sidebar
- Create your first project
- Add tasks to that project
- Return to dashboard to see updated metrics
Quick Actions from Dashboard
Creating New Items
While on the dashboard, you can quickly:
-
Start a New Project
- Navigate to Project → Click "Add Project"
- Fill in the project creation form
-
View All Projects
- Click on the "Total Projects" card
- Or use the Project menu item
-
Manage Tasks
- Click on the "Total Tasks" card
- Or navigate to any project to manage its tasks
-
Access Reports
- Use Project Report in the sidebar
- Generate custom reports based on date ranges
Next Steps
Now that you understand the Trackr Dashboard, proceed to:
- Creating Your First Project - Learn how to set up projects
- Managing Tasks - Understand task workflows
- System Setup - Configure Trackr for your needs
- Generating Reports - Create meaningful analytics
Troubleshooting
Dashboard Not Loading
Issue: Dashboard shows blank or loading indefinitely
Solutions:
- Refresh your browser (F5 or Ctrl+R)
- Clear browser cache
- Check your internet connection
- Contact support if issue persists
Metrics Not Updating
Issue: Numbers on metric cards don't reflect recent changes
Solutions:
- Navigate away and back to dashboard
- Refresh the page
- Check if changes were saved properly
- Verify you have proper permissions
"No Data Found" Message
Issue: Dashboard shows empty state despite having data
Solutions:
- Verify projects and tasks were created successfully
- Check date filters if any are applied
- Ensure you have access permissions to view the data
- Try logging out and logging back in
Support and Help
If you need assistance:
- User Guide: Click on "User Guide" in the sidebar for detailed documentation
- Support Ticket: Submit a support ticket for technical issues
- Team Chat: Ask colleagues for help via internal chat
- Contact: Reach out to Blockpeer support team
Summary
The Trackr Dashboard is your command center for managing all trading and shipping operations. It provides:
✓ Real-time visibility into projects, tasks, bugs, and team members
✓ Quick access to all major functions via sidebar navigation
✓ Visual indicators of system status and workload
✓ Foundation for effective project management
Master the dashboard, and you'll have complete control over your operational workflow.