Generating Reports in BlockPeer Books
Dashboard Overview
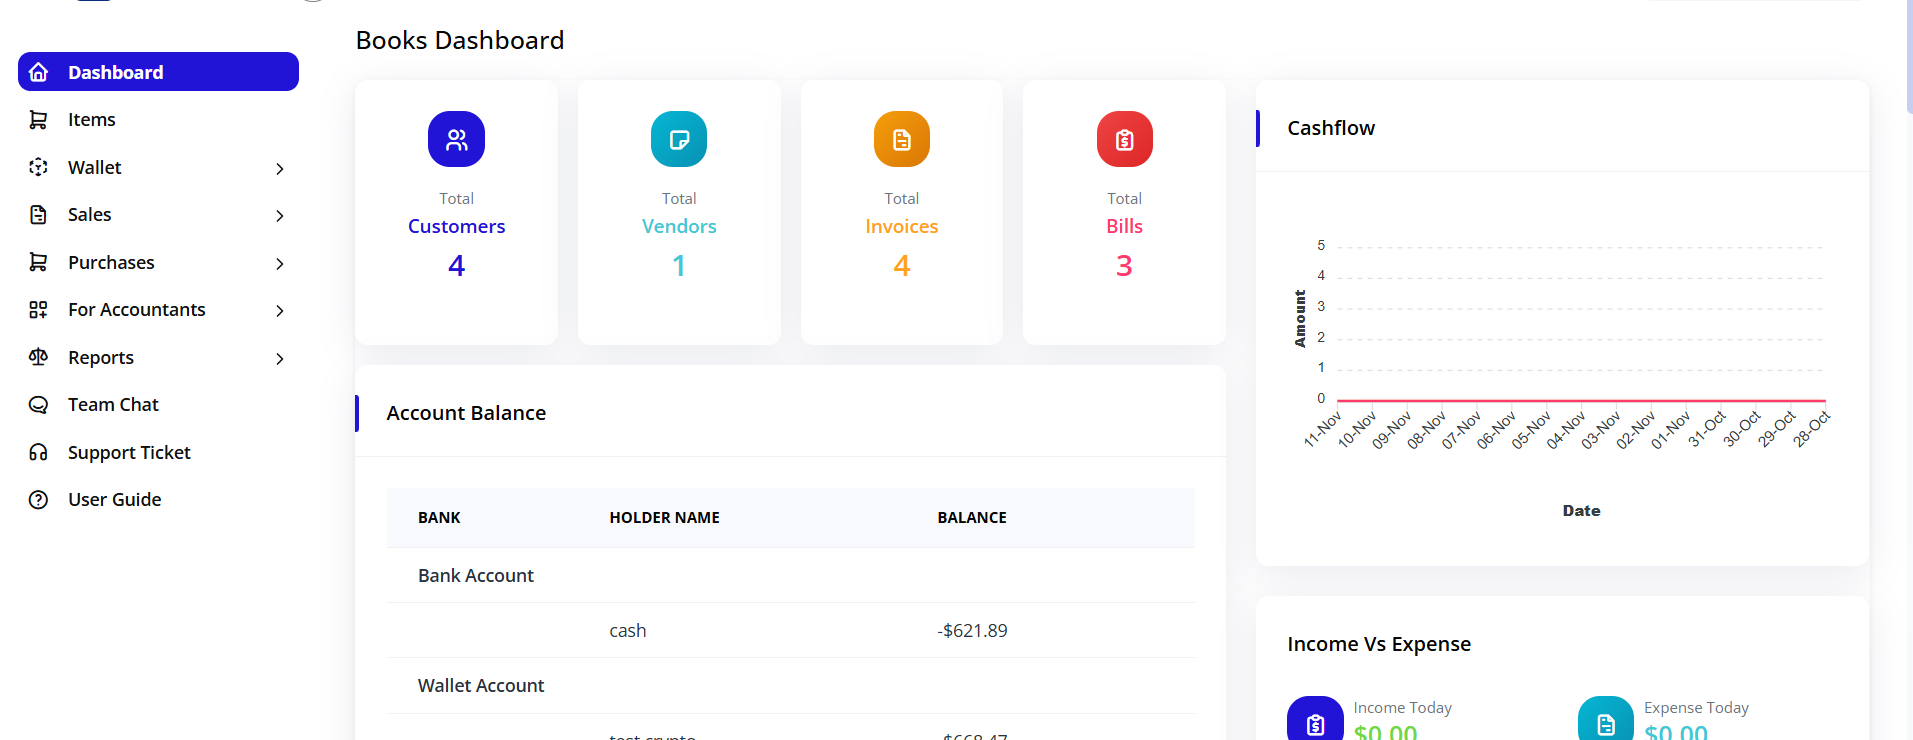
Accessing Dashboard
- Go to Dashboard after opening Books module
- See key financial metrics:
- Total Assets (all assets combined)
- Total Liabilities (all debts)
- Net Worth (Assets - Liabilities)
- Monthly Revenue (current month)
- Monthly Expenses (current month)
- Current Balance (cash/liquid assets)
Dashboard Widgets
Click any widget to drill down for details.
Standard Reports
1. Profit & Loss (Income Statement)
Shows revenue, expenses, and net profit/loss for a period.
How to Generate:
- Go to Reports → Profit & Loss
- Configure:
- Period: This Month, This Year, Custom (select dates)
- Department: All or specific
- Include Subcategories: Yes/No
- Comparative: None, Year-over-Year, Period-over-Period
- Click Generate
What You See:
-
Revenue
- Sales revenue
- Other income
- Total revenue
-
Expenses
- Operating expenses
- Cost of goods sold
- Other expenses
- Total expenses
-
Net Profit/Loss = Revenue - Expenses
Export Options:
- PDF (printable)
- Excel (editable)
- CSV (for external tools)
2. Balance Sheet
Shows what you own (assets), owe (liabilities), and net worth (equity) at a specific date.
How to Generate:
- Go to Reports → Balance Sheet
- Configure:
- As of Date: Select specific date
- Include: Assets, Liabilities, Equity (all checked by default)
- Format: Standard or Detailed
- Click Generate
What You See:
-
Assets (Left side)
- Current Assets (cash, accounts receivable, etc.)
- Fixed Assets (equipment, property, etc.)
- Total Assets
-
Liabilities (Right side)
- Current Liabilities (payables, short-term debt)
- Long-term Liabilities (mortgages, bonds)
- Total Liabilities
-
Equity
- Capital contributed
- Retained earnings
- Total Equity
Verification: Total Assets should = Total Liabilities + Total Equity
3. Trial Balance
Verifies accounting equation (Debits = Credits).
How to Generate:
- Go to Reports → Trial Balance
- Select As of Date
- Click Generate
What You See:
- All accounts listed with:
- Account name
- Debit balance (left side)
- Credit balance (right side)
- Total debits
- Total credits
Verification: If accounting is correct: Total Debits = Total Credits
4. Account Statement
Detailed transactions for a single account.
How to Generate:
- Go to Reports → Ladger Summary
- Select account
- Choose date range
- Click Search
What You See:
- Opening Balance
- Date of transaction
- Description
- Amount
- Transaction reference
- Closing Balance
Cryptocurrency-Specific Reports
Cost Basis Report
Important for tax purposes. Shows cost basis for sold crypto.
How to Generate:
- Go to Wallet → Crypto Reports
- Select:
- Date Range: Full year or custom
- Cryptocurrency: All or specific (Bitcoin, Ethereum, etc.)
- Cost Method: FIFO, LIFO, or Average
- Click Search
What You See:
- Each sale of crypto with:
- Date sold
- Amount sold
- Cost basis
- Sale price
- Gain/loss on each transaction
Historical Report
Shows your current crypto positions.
How to Generate:
- Go to Wallet → Crypto Report → Historical Report
- Select As of Date
- Click Generate
What You See:
- For each type of crypto:
- Amount held
- Cost basis of current holdings
- Unrealized gain/loss (paper gain/loss)
- Total portfolio value
- Total unrealized gain/loss
Roll Forward Report
For the Roll Forward.
How to Generate:
- Go to Reports → Crypto Reports → Roll Forward Reports
- Select:
- Date Range: Month, Quarter, Year
- Walllet: Wallet address
- Ticker Type: ETH etc
- Click Search
What You See:
- Each income item with:
- Opening Balance
- Date received
- Identifier
- Ledger
- Amount
- Balance
Exporting Reports
Export a Report
Any report can be exported:
- Go to Reports → Select Any Report
- Click Download